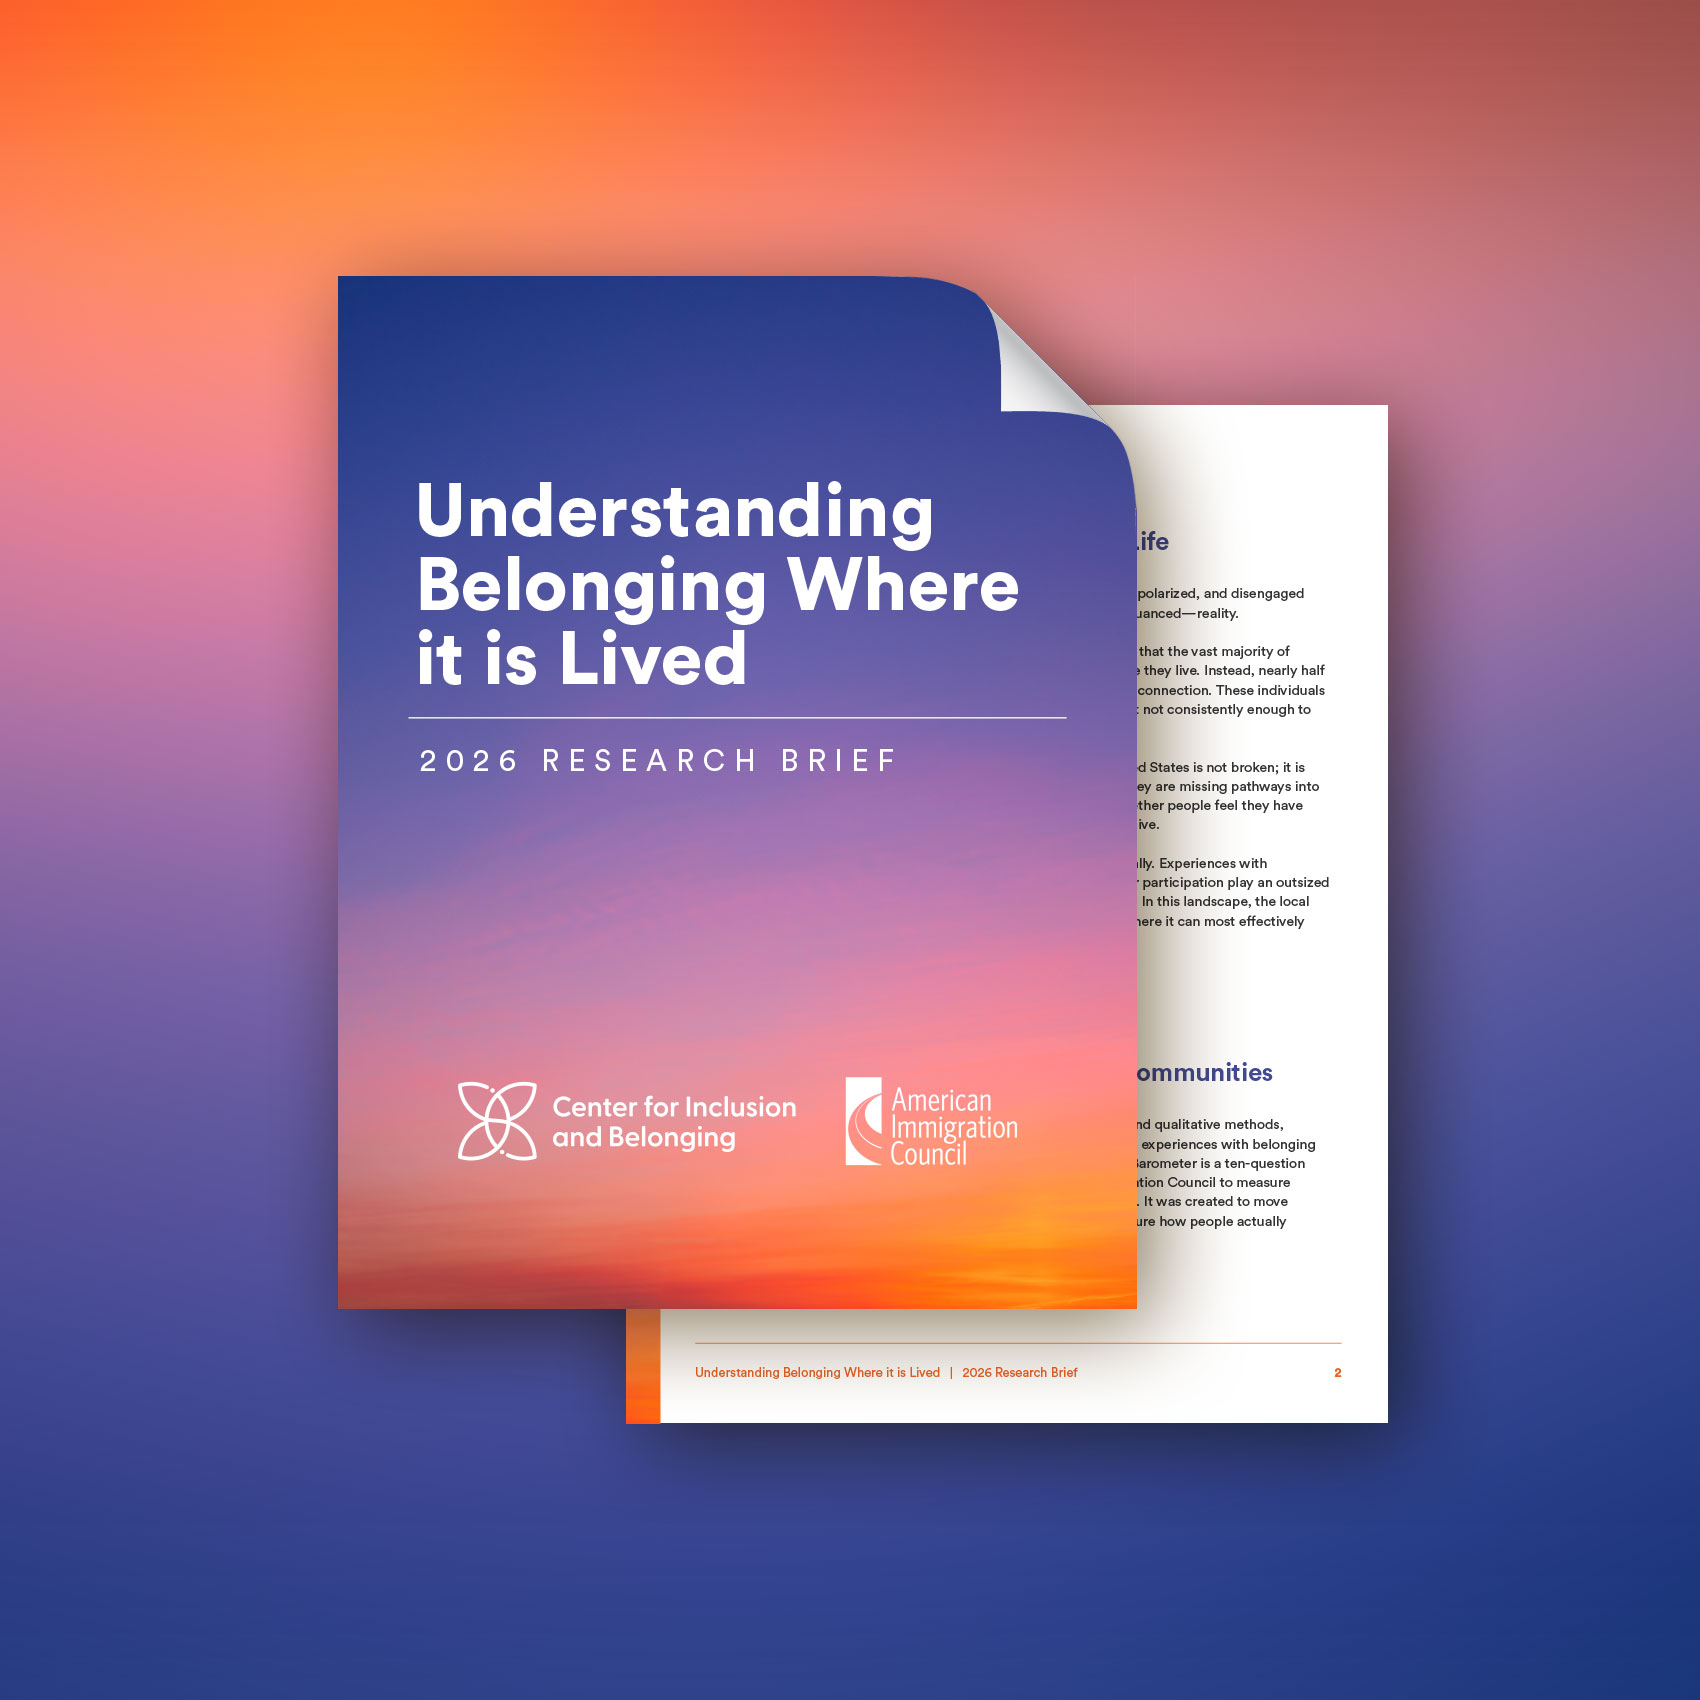


What We Learned About Belonging in America’s Communities
The Belonging Barometer was first used in 2021, revealing one clear finding: belonging at the local level was consistently lower than in other areas of life. That pattern raised important questions. In this most recent Belonging Barometer National Survey, we explored not only how people experience belonging in their communities, but also how those local experiences shape broader feelings of connection, trust, and belonging across American life. The results reveal where belonging is weakening, and where communities have the greatest opportunity to strengthen it.

Understanding Local Belonging
A mixed landscape for local belonging: strong psychological safety, weak agency, and split social connection

There is hope in local investment: Most Americans are not disengaged or alienated—they are somewhere in the middle. Belonging is malleable.

Consuming local – but not national – news more frequently leads to a greater sense of belonging.

Older Americans have a greater sense of belonging

Explore more data and insights
WEBINAR
Tuesday September 29 | 3PM EST
Want to improve programs, engage residents, and make more informed decisions? Join researchers and practitioners from the Center for Inclusion and Belonging as they explore findings from the 2026 Belonging Barometer study.
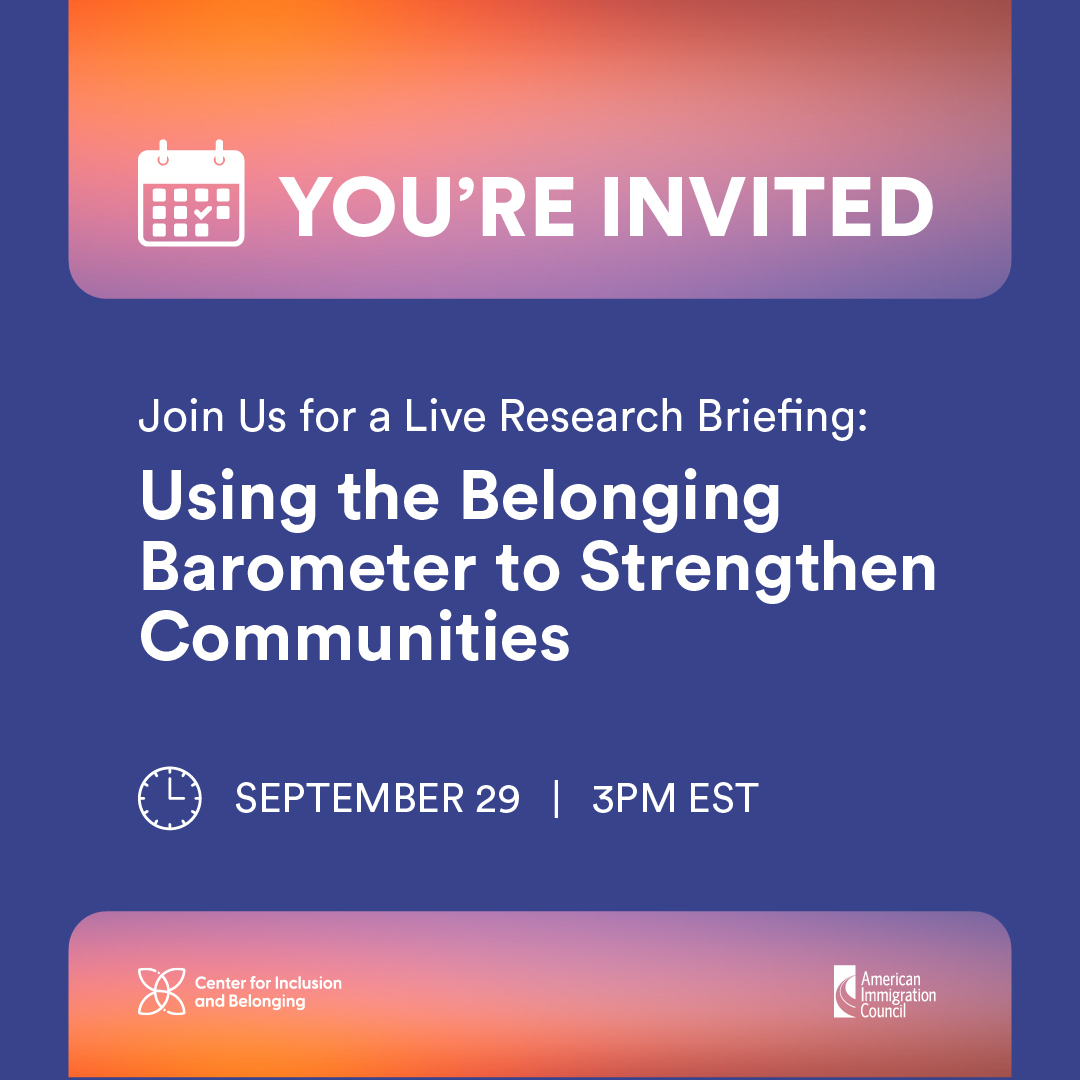
Using the Belonging Barometer
The Belonging Barometer is a free, research-based survey that helps organizations understand whether the people they serve feel connected, safe, and empowered to shape their communities. The ten-question survey measures three core dimensions of belonging: emotional connection (feeling valued and accepted), psychological safety (being able to express oneself), and community influence (having a voice in decisions). Organizations use the tool to establish baselines, evaluate programs, inform strategy, identify disparities, track progress, and demonstrate impact to funders and community partners.
You don’t need a complicated process to start learning how people experience belonging. Use the Barometer questions to:
- Tailor strategies to the needs of your community
- Survey residents, employees, students, families, or community members
- Identify opportunities to strengthen relationships and engagement
The Belonging Handbook
Using the Handbook
Explore the Belonging Handbook, a practical resource for turning the Belonging Barometer’s insights into action and creating communities where everyone feels seen, valued, and able to participate.
Insights
There is real hope in investing locally. With intentional support in participation, inclusion, and local connection, communities can help more people feel that they truly belong where they live.
- Real people already demonstrate what works locally.
- Belonging is built over time and local investment can accelerate it.
- Local belonging is not defined by geography or politics.
Ready to strengthen belonging in your community?
Connect with the Center for Inclusion and Belonging to learn how the Belonging Barometer can help you listen, measure, and take action.
NEWS

Photo Credit: Nancy Battaglia, Adirondack Foundation, Trust for Civic Life
National Study: Only 1 in 4 Americans Believe They Can Influence Outcomes In Their Local Community
Organizations Building Belonging
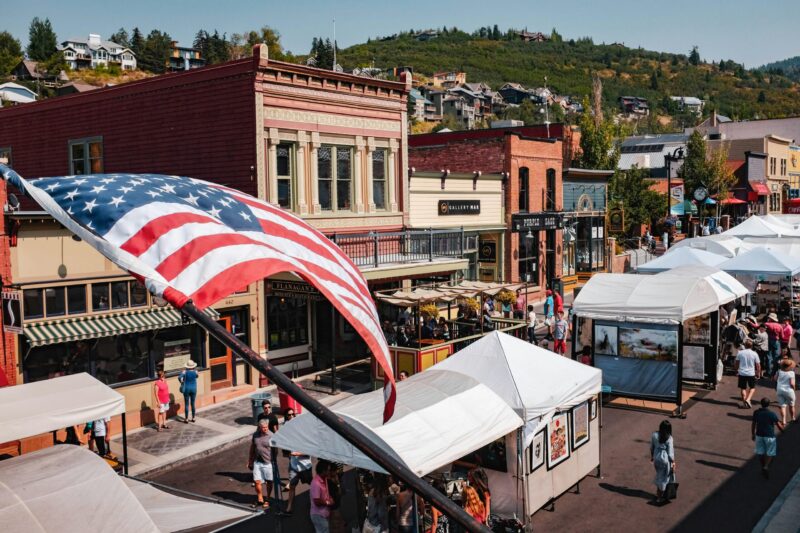
Measuring What Matters: How Washington Main Street Is Using the Belonging Barometer to Strengthen Downtown Communities
For decades, community revitalization has been measured by what we can easily count: number of new businesses, jobs created, building rehabilitations,…
Read More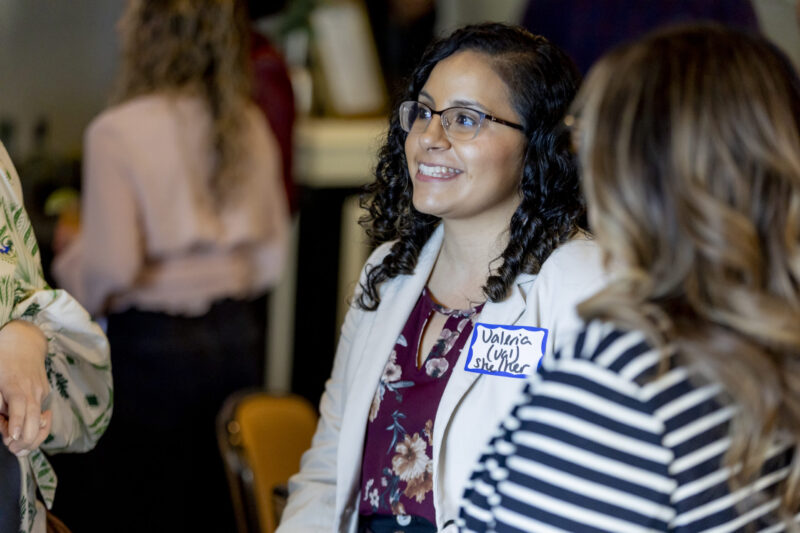
How One Rural Nonprofit Turned Belonging Into a Community Strategy
Empowering Families, a nonprofit in western Nebraska, is transforming its programs and impact.
Read More