 The American Immigration Council is a non-profit, non-partisan organization.
 The U.S. immigration system is broken — it’s a phrase heard often in discussions about the state of immigration in the U.S. Now, a new interactive dashboard from the American Immigration Council allows anyone with an internet connection to better understand our dysfunctional system of legal immigration.
The dashboard is the most comprehensive public compilation of U.S. Citizenship and Immigration Services (USCIS) data to date, with at least 20,000 data points for more than 190 immigration application and petition types between fiscal year (FY) 2016 through FY 2025. Users can track trends in filings, processing times, backlogs, and denial rates across years, and make comparisons across categories.
At a time when immigration policy continues to play a central role in our national discourse, the dashboard helps illustrate a fundamental truth: USCIS has struggled to manage the volume of applications and petitions it receives from people seeking to obtain or maintain immigration status in the United States, and its performance has deteriorated over time, shaped in part by policy choices across administrations and the effects of the COVID pandemic.
Pending cases continue to pile up
The Council’s analysis of the data shows that the USCIS backlog has more than tripled over the last decade, from 3.5 million cases in the first quarter of FY2016 (October–December 2015) to 11.6 million in the fourth quarter of FY2025 (July–September 2025).
The dashboard also reveals that completions began to fall behind new filings in 2020 and 2021, when the COVID-19 pandemic slowed processing and policy changes implemented during the first Trump administration severely limited the agency’s capacity and efficiency, leaving it unprepared to deal with a surge of new filings in 2021.
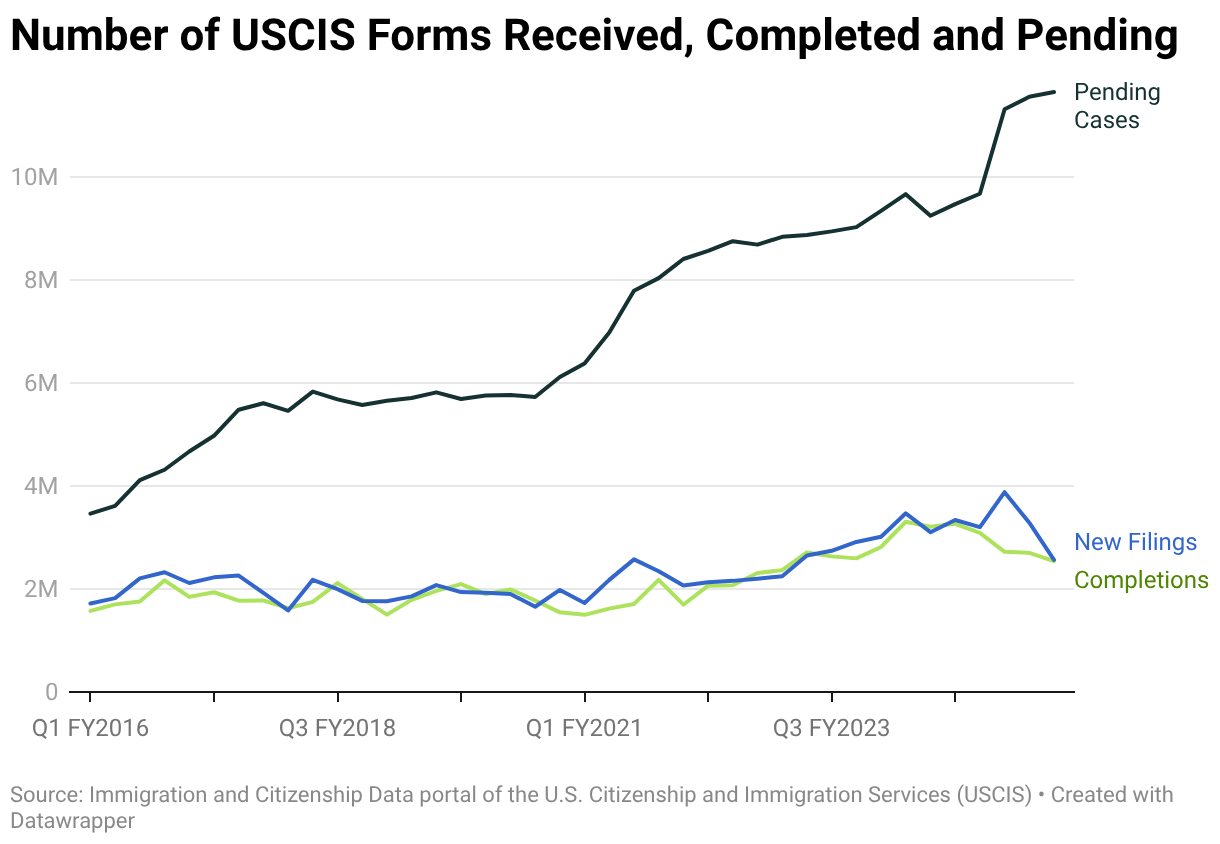
In just 15 months, between June 2020 and September 2021, the backlog grew by 2.3 million cases. Between April and June 2021, the efficiency ratio, which measures completed cases relative to new filings in a given quarter, fell to a record low of 0.66. During that quarter, USCIS received 2.6 million applications and petitions but processed just 1.7 million, adding 866,910 forms to the backlog in just three months.
By the end of the Biden administration, it would have taken 9.4 months to clear the backlog at the processing capacity between October and December 2024.
In 2025, the backlog surged by an additional 2 million cases, following a rise in new applications and petitions at the beginning of the new year and a decline in completions in the first three quarters of the second Trump administration. At the processing capacity between July and September 2025, it would have taken 13.8 months to clear the backlog.

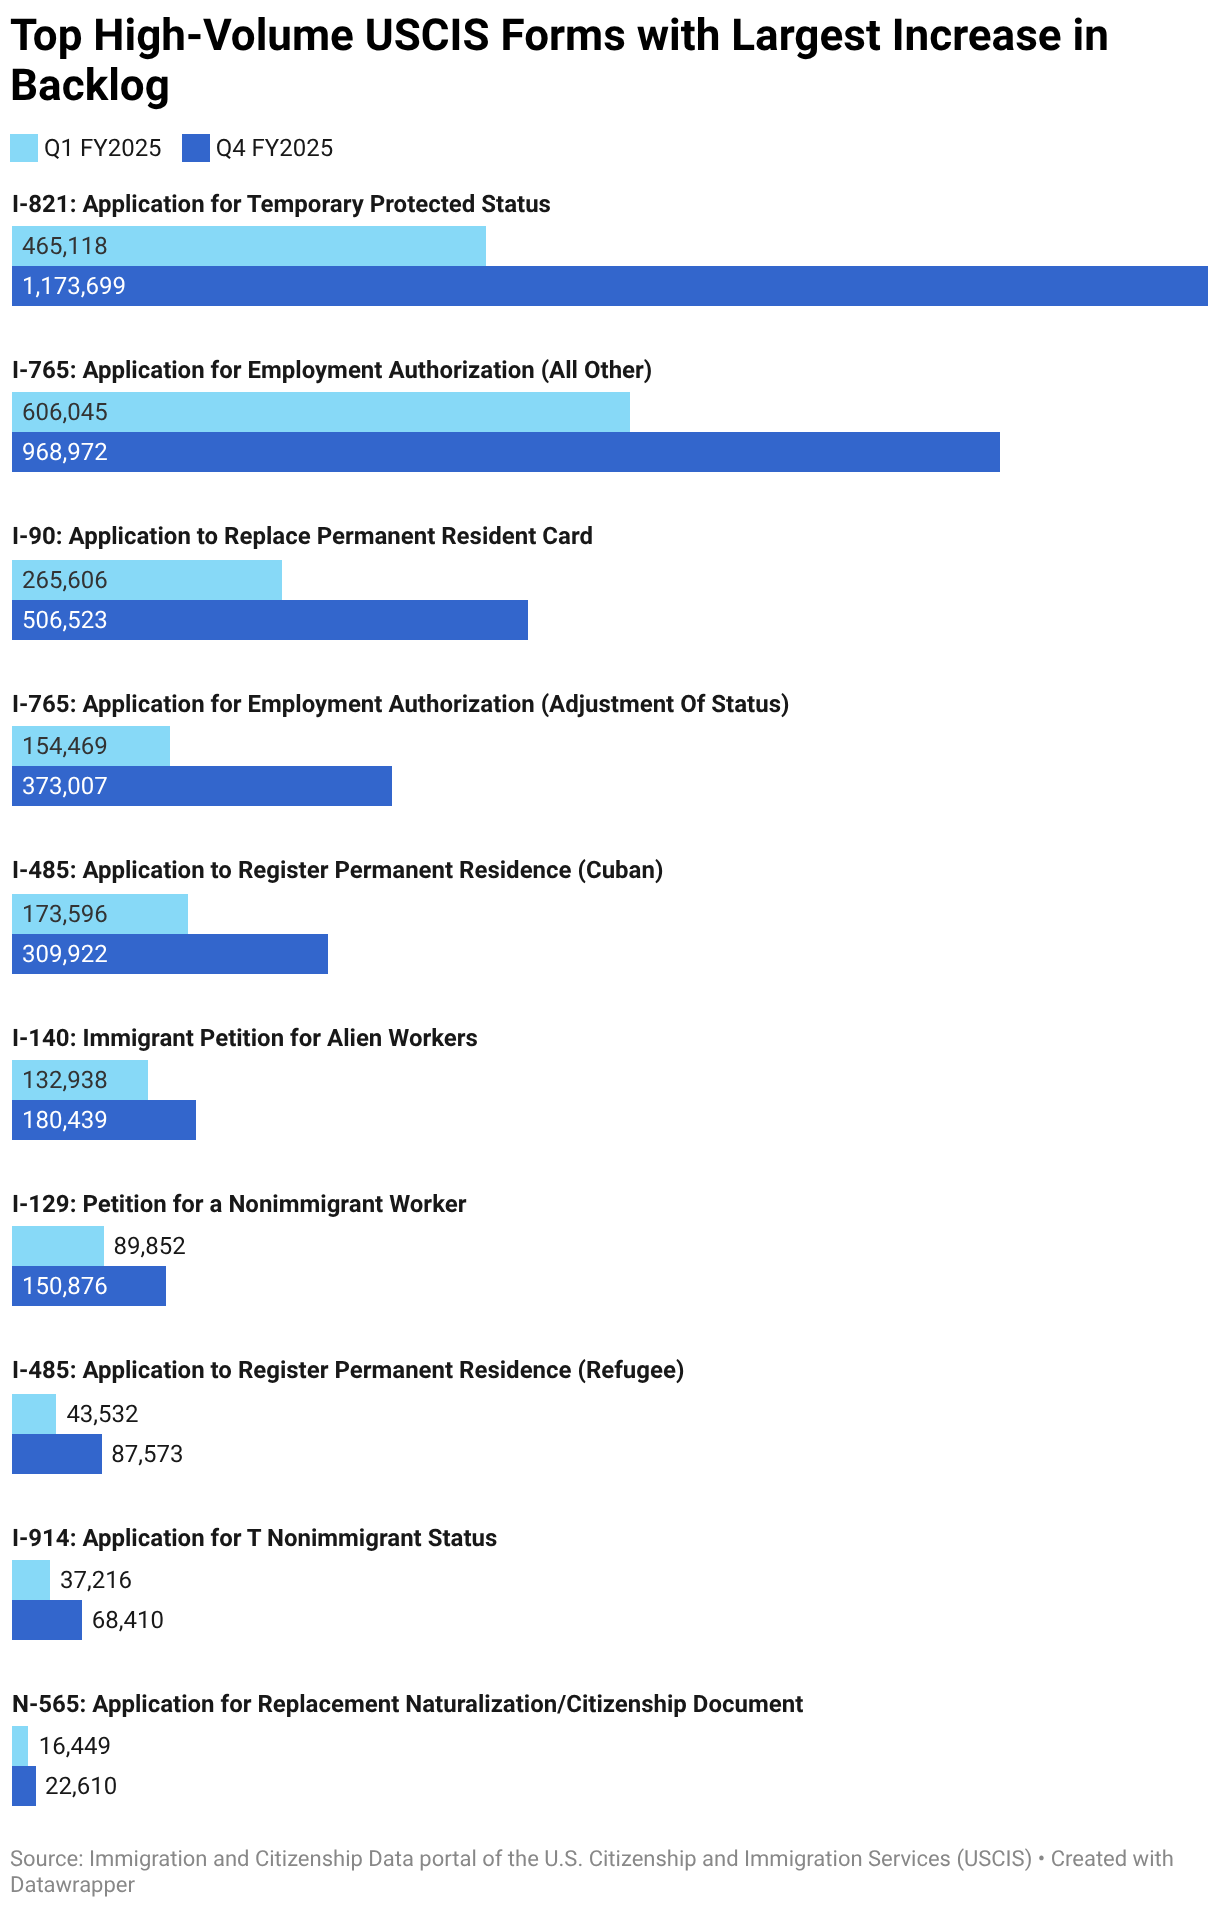
Among high-volume forms with more than 10,000 filings in the most recent quarter, applications for Temporary Protected Status (TPS) experienced the largest increase in pending cases between October and December 2024, the final full quarter of the Biden administration, and July through September 2025, the most recent period for which data are available. During this time, the number of pending TPS applications rose by roughly 150%, from 465,118 to nearly 1.2 million applications.
Pending requests for employment authorization (EAD) for individuals with green card applications more than doubled over the same time period, increasing from 154,469 to 373,007. Notably, pending petitions for both non-immigrant and immigrant workers also increased substantially, by 67.9% and 35.7%, respectively.
Denial rates remain elevated across form types
Overall USCIS denial rates increased from 8.6% in Q1 FY2016 to a peak of 14.9% in Q4 FY2022, before settling at a still elevated 11.1% in Q4 FY2025.
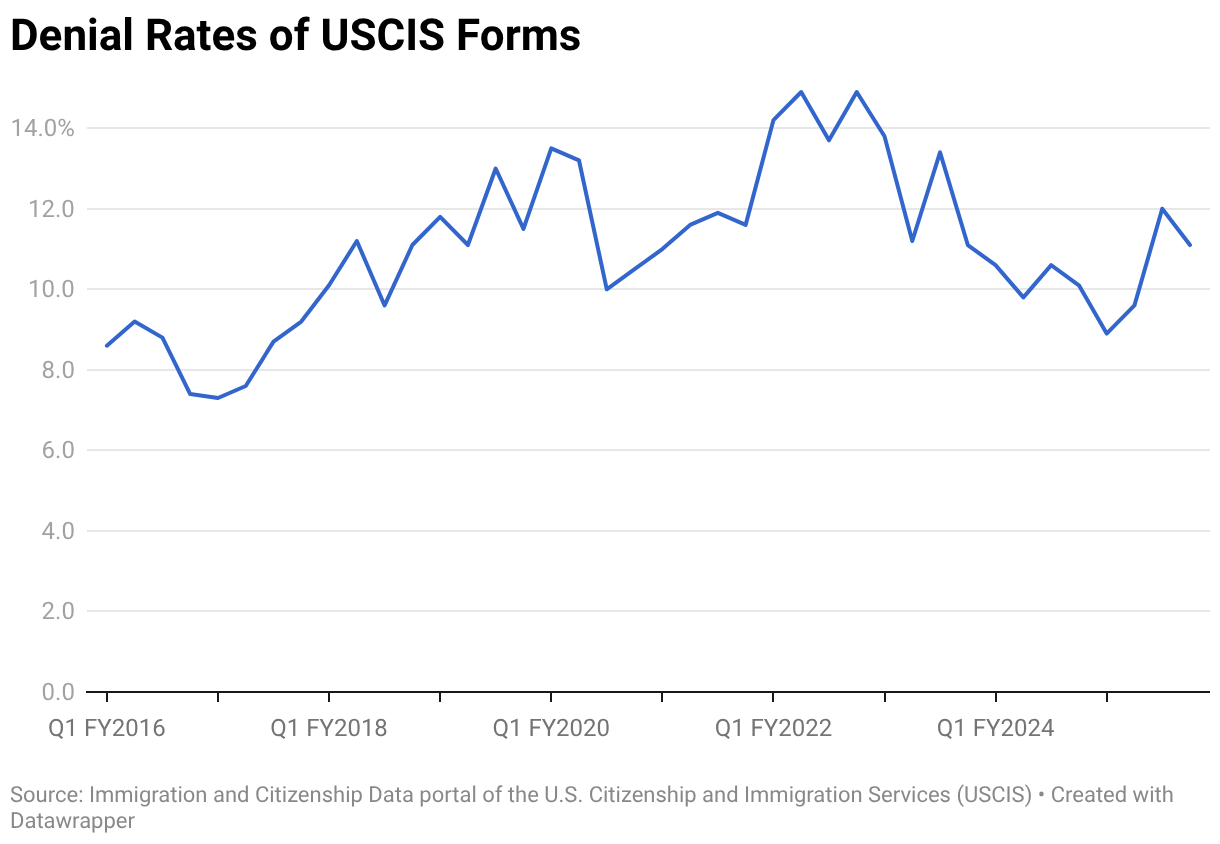
Most major form types experienced rising denial rates between Q1 FY2025 and Q4 FY2025. Among high-volume forms, the denial rate for TPS applications soared from 2.9% to 12.8%. Meanwhile, the denial rate for EAD applications filed by people with pending green card applications more than doubled, from 5.1% to 13.6%. Denial rates for waiver applications also rose sharply, from roughly one in five applications to one in three.

Often, such changes can reasonably be directly attributable to policy change. For example, after the first Trump administration issued its “Buy American and Hire American” order in April 2017, USCIS heightened its scrutiny of applications, expanded its use of Requests for Evidence (RFEs), and narrowed its interpretation of specialty occupations.
Following this policy shift, the Council’s dashboard shows that denial rates for initial H-1B visa petitions for immigrant workers in specialty occupations climbed from 5.8% in Q3 FY2017 to 17% in Q1 FY2018. At the same time, RFEs more than doubled, rising from 19,480 to 44,306.
Using data to better understand the state of our immigration system
The data makes clear that the USCIS has failed to keep pace with the rising number of applications and petitions it receives. Backlogs are historically high, forcing USCIS workers to spend time managing cases rather than resolving them. Longer processing times increase hardship for applicants, petitioners, and beneficiaries. They also drive repeat filings, and make outcomes less predictable.
By bringing nearly a decade of USCIS data into one interactive view, the Council’s dashboard seeks to increase understanding of the state of the U.S. system of legal immigration. Policymakers, journalists, advocates, and the public can explore the extensive database to better understand how ill-equipped USCIS is under the current demand and how inefficiency can become a policy choice in the hands of an administration determined to allow fewer people into the United States.