Executive Summary
Immigration court proceedings are a way for most noncitizens subject to immigration enforcement in the United States to both contest their deportation from the country and seek a legal immigration status. However, these courts are housed within the Department of Justice—an executive agency—which means the president holds immense influence over the court system. Since day one of his second administration, President Trump has not shied away from wielding his authority to quickly erode noncitizens’ due process to more easily meet his administration’s deportation quotas.
Due to both increased immigration arrests and policies favoring immigrant detention, an increasing number of “respondents”—the term used for people placed in immigration court proceedings—must pursue their case from inside an immigrant detention center. Detention features not only inhumane and deadly conditions, but geographic isolation and limited access to attorneys. This exacerbates the already inherent barriers immigrants face within the immigration court system.
Deepening these disadvantages, most noncitizens must navigate the complicated process, including complex immigration laws, alone.1 While the Sixth Amendment offers a right to an appointed lawyer in the criminal legal system for any person unable to afford one, in the U.S. civil immigration system, no such constitutional right exists.
Using immigration court data from fiscal year (FY) 2019 through FY 2024—publicly accessible in a new interactive data tool—this report examines the role of legal representation in shaping outcomes in immigration court proceedings.
Ultimately, we conclude that having an attorney is associated with better outcomes regardless of whether a person is detained or where the case is heard.
Still, disparities remain as both non-detained and detained respondents in certain parts of the country face removal order rates that are substantially lower than others. Overall, however, respondents in detention faced lower representation rates and higher removal order rates. In addition, we find that policy changes likely played a role in influencing case outcomes as changes in removal order rates mirrored changes in presidential immigration court policies and federal immigration enforcement priorities.

Key findings
- Immigrants with an attorney were less likely to be ordered removed.
- Between FY 2019 and FY 2024, only 26.9 percent of respondents with legal representation—regardless of custody status—were ordered removed, compared to 61.8 percent of unrepresented respondents.
- Among non-detained respondents, those without legal representation were over 2.5 times more likely to be ordered removed than their represented counterparts.
- Detained respondents who were unrepresented were 10.5 percentage points more likely to be ordered removed than detained respondents with legal representation.
- Legal representation rates vary widely across the country, especially in detention.
- Courts on the Pacific Coast have the highest legal representation rates among non-detained cases (58.3 percent), while courts in the South have the lowest (39.8 percent). The Honolulu Immigration Court in Hawai’i has the highest representation rate with nearly 70 percent of non-detained respondents having legal representation—almost three times the rate at Harlingen, Texas (25.2 percent).
- The highest and lowest representation rates for detained cases are spread across multiple regions, showing less clear regional patterns than in non-detained cases. However, the Northeast had the highest representation rate (55.7 percent), while the Mountain region had the lowest (25.4 percent). Respondents in New York's Varick Immigration Court were 4.5 times more likely to have legal counsel than those in Arizona's Florence Immigration Court.
- Removal order rates also vary widely—and detained respondents experience the highest rates.
- Removal order rates of non-detained cases vary widely across the country. Three of the top five courts with the highest rates are near land borders, such as Harlingen (Texas), Buffalo (New York), and Imperial (California). Courts with the lowest removal order rates are geographically diverse—in states like Florida, Massachusetts, California, and Puerto Rico—suggesting that local factors like caseload size and legal representation may influence outcomes.
- Detained respondents face systematically higher removal order rates compared to their non -detained counterparts, with the top five courts’ removal order rates exceeding 90 percent and the court with the lowest (El Paso, Texas) not far behind at 72.9 percent.
- Policy changes likely influenced case outcomes.
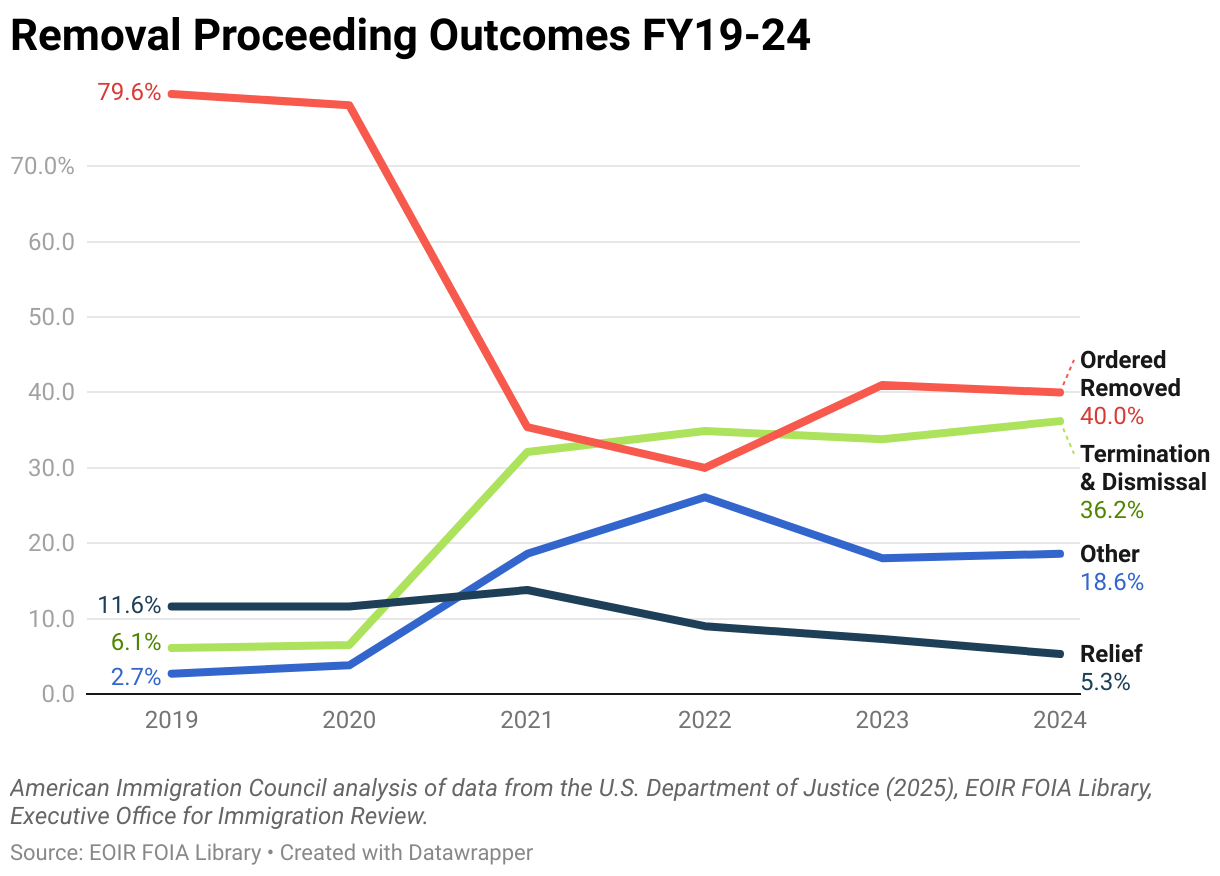
- Case outcomes shifted sharply across the two presidential administrations during the period of our analysis. While outcomes were impacted by independent events, such as the COVID-19 pandemic, there are marked differences in outcomes when we compare the first year and last year of the six-year period. Removals made up 79.6 percent of outcomes in FY 2019 (during the Trump administration) but only 40 percent in FY 2024 (during the Biden administration).
- Case outcomes became more varied under the Biden administration. In FY 2019, only 20.4 percent of cases allowed respondents to remain in the United States compared to 60 percent in FY 2024.
Want more analysis like this?
Subscribe for our weekly newsletter for expert analysis and news.
Background
What does our immigration court system look like?
The United States’ immigration courts are part of an administrative system overseen by the Executive Office for Immigration Review (EOIR), which is an agency within the Department of Justice (DOJ). EOIR includes both the immigration courts, whose immigration judges are attorneys appointed by the U.S. Attorney General to adjudicate cases, and the Board of Immigration Appeals (BIA), which is an appellate body that reviews appeals from immigration judge decisions and sets precedential legal opinions. The Department of Homeland Security (DHS), through U.S Immigration and Customs Enforcement’s (ICE) Office of the Principal Legal Advisor (OPLA), represents the United States in immigration court proceedings against noncitizens alleged to be in violation of civil immigration law.
As of FY 2024, there are 70 administrative control immigration courts in 31 states or territories. These immigration courts oversee hearings within a certain geographic area, including for people who are in and outside DHS custody. Custody status—whether a person is held inside a detention center or not during and up to the conclusion of their case—matters significantly as detained immigrants are often held in remote detention centers with severely limited access to family, the public, and attorneys. In addition, researchers have noted that detained and non-detained cases often operate as “two separate immigration court systems,” each with distinct judges, courtrooms, and procedures.
That said, as the second Trump administration expands immigration detention to historic levels, EOIR has instituted policies that make it easier to transfer cases from non-detained to detained dockets. During the six-year period of this study, the types of cases adjudicated were concentrated in specific courts: 33 handled non-detained cases, 18 handled detained cases, and 19 adjudicated both.2
The interactive map below displays all U.S. immigration courts, categorized by the types of cases they adjudicate—Detained, Non-Detained, or Both. Use the buttons above the map to filter the courts by the types of cases they hear. Hover over a point or cluster to view court details.
Types of Cases Heard:
To determine these categories, courts were identified as handling a given case type if they completed at least 500 cases between FY 2019 and FY 2024 for that type. Because detained caseloads have fluctuated over time due to operational and policy changes, only courts that completed at least 82 detained cases (one-sixth of all cases) in the most recent year were classified as currently adjudicating detained cases.
In the last decade, the immigration court system grew substantially. Between FY 2014 and FY 2024, 11 net immigration courts were added and EOIR nearly tripled the number of immigration judges.
However, the courts are far more bottlenecked than they were a decade ago—largely due to the tremendous rise of new cases resulting from an increase in migrants presenting themselves at the U.S.-Mexico border to apply for asylum and other protections. In FY 2014, there were 430,312 pending cases. By FY 2024, that number grew by nearly 811 percent to 3,918,340. This means that in FY 2024 each immigration judge had 5,330 cases on average. Of course, caseloads across immigration courts vary widely. Some courts primarily serve one state or one region within a state, while others serve several states. And yet others, like those located in detention centers, are often in geographically isolated areas and serve a specific population. Recently, starting in June 2024, border encounters have dropped to historic lows leading to decreases in new court filings.
Currently, the second Trump administration has focused on dismantling due process and immigration court operations by firing immigration judges hired under his predecessor, allowing for the termination of asylum applications without a court hearing, discouraging the temporary closure of non-priority cases, seeking to bypass immigration judge review through the legally questionable use of “expedited removal,” and increasing the use of detention as a means to pressure noncitizens to accept their deportation without a court hearing.
Some of these policies—such as firing judges—are likely to exacerbate bottlenecks, while others could lead to a reduction in backlogs simply by preventing respondents from accessing the due process and relief to which they are legally entitled. But ultimately, both types of changes point in the same direction—they create policy “whiplash” that exacerbates the immigration court system’s fundamental unevenness. Amid all the inconsistent decision-making and disparities in outcomes among judges and courts, however, one factor stands out as a powerful and consistent influence on outcomes: legal representation.
About the immigration courts data
The American Immigration Council (the Council) analyzed publicly available data released by EOIR.
The immigration courts oversee different types of proceedings. In the overwhelming majority, judges consider whether a person is deportable or “removable” from the United States in removal proceedings.3 The Council focused its analysis on 2,287,930 cases in removal proceedings that were completed by administrative control immigration courts between FY 2019 and FY 2024. However, while we include all courts in the total count of cases, this report excludes from its court-level analysis two courts whose caseloads were too small to be significant: Hagåtña in Guam and Saipan in the Northern Mariana Islands.
In our analysis below, we also separate cases that were completed while a person was in custody (“detained” cases) from those completed while the person was not in custody (“non-detained” cases).4 As we explain further below, studies have shown that detention plays a significant role in a person’s ability to successfully present their case to an immigration judge.
Building on prior analyses of EOIR case data, we examined cases where a substantive, rather than procedural, decision, was reached. A substantive decision applies the law to the facts of the case whereas a procedural decision concerns the court’s rules and process. We reference the substantive decision as the initial merits decision. This allows us to compare cases at the same stage and to assess their outcomes, including the type of relief ultimately obtained by the person facing removal.
Our analysis focuses on the initial merits decision of the case made by an immigration judge. It does not include any subsequent decisions made on the merits in that person’s case. A subsequent decision could occur when a party to the case requests that the case be reopened due to a change in the law or facts of the case, or after an appellate body returns the decision to the judge for reconsideration.5
For this report, we classified the following outcomes at the initial merits decision stage:
- Ordered Removed: includes outcomes where a removal order was entered or voluntary departure granted. This also includes cases where a respondent was granted withholding of removal under the Immigration and Nationality Act and withholding or deferral of removal under the Convention Against Torture as respondents receive removal orders in these cases.6
- Relief: includes outcomes where the respondent received a longer-term immigration status, including asylum and cancellation of removal.
- Termination and Dismissal: includes outcomes where a case was either terminated (by the court) or dismissed (at the request of the respondent and/or government (OPLA) attorneys).
- Other: includes decisions in which the respondent is not required to leave the United States (i.e. not ordered removed), but is not otherwise granted a permanent immigration status. This category includes among others, withdrawn cases; administratively closed cases; cases dismissed due to the federal government’s failure to prosecute; and decisions labeled by the court as “other administrative completion,” which is a broad but seldom-used classification for cases not completed on the merits.
We did not include proceedings that were marked as completed either due to a motion to change venue or a motion to transfer a case.7
To determine whether a person had legal representation, we followed a similar process established in our previous special report, “Access to Counsel in Immigration Court.” First, we looked at whether a Form EOIR-28, Notice of Appearance, was filed at the immigration court prior to case completion or, if the attorney filed the form after the initial merits decision occurred, they appeared in at least one hearing that took place during the proceeding. Starting in September 2022, attorneys were required to provide notice to the courts of “limited” support if they helped unrepresented respondents with document preparation by filing Form EOIR-61, Notice of Entry of Limited Appearance for Document Assistance Before the Immigration Court. We do not include limited appearances as those attorneys did not provide full representation.
Immigrants with an attorney were less likely to be ordered removed
Our analysis of the EOIR data between FY 2019 and FY 2024 reveals that legal representation is associated with significantly lower removal order rates in immigration court proceedings. Regardless of custody status, only 26.9 percent of respondents with legal representation were ordered removed compared to 61.8 percent of those without representation.
Considering custody status, we see that a person’s detention at the time of their case completion is associated with certain outcomes. Among non-detained respondents, those without legal representation were 35.1 percentage points, or over 2.5 times, more likely to be ordered removed. For detained respondents, while legal representation was associated with lower removal order rates, detention itself remained a strong factor in increasing the likelihood of receiving a removal order. Specifically, 93 percent of detained respondents without representation were ordered removed, compared to 82 percent with counsel—a difference that means unrepresented detained people were 10.5 percentage points more likely to be ordered removed.8
Despite these findings, removal order rates varied dramatically throughout the six-year period of this report. This is largely because immigration courts experienced disruptions in case processing caused by the COVID-19 pandemic. Several operational changes allowed the immigration court system to function at a significantly reduced capacity; however, these changes impacted detained and non-detained cases differently.

For example, in March 2020, EOIR prioritized hearings for detained respondents and suspended hearings for those not in custody. The detained population declined largely in response to lawsuits that forced ICE to reduce overcrowding to limit the spread of the virus in detention facilities. This led to a drop in the overall number of completed detained cases—from 45,306 in FY 2020 to just 15,572 in FY 2021 and 14,846 in FY 2022.
At the same time, non-detained cases were postponed for months and completed cases dramatically decreased in FY 2021. While hearings in some courts resumed in late June 2020, by April 2021, only 32 of the 50 courts handling non-detained cases had restarted operations—many still at reduced capacity. Between March and October 2020, EOIR postponed nearly 600,000 hearings due to pandemic closures. Case filings slowed as fewer migrants arrived and the Trump administration imposed border expulsions without hearings. By March 2021, more migrants were presenting themselves at the border who could not be expelled due to their nationality, increasing the number of people placed in removal proceedings.
Despite the continued processing of non-detained cases, many of the changes EOIR implemented for these cases introduced challenges for unrepresented respondents who were less likely to access or benefit from them. For example, to continue limited operations for non-detained cases, EOIR encouraged government attorneys and counsel for respondents to resolve issues outside of formal hearings and to appear at hearings virtually. To file case documents with the court, attorneys could use the EOIR Courts & Appeals System (ECAS), an electronic filing system for the courts. Only a limited number of courts had it in place in 2020 and it was not fully expanded to all courts until November 2021. ECAS was not available to unrepresented respondents for all court filings until July 2024.
Notwithstanding these disruptions by the pandemic, we find that having an attorney was overall still associated with lower removal order rates. Representation improves a respondent’s chances of remaining in the country by ensuring that they can present their case effectively, access relief for which they qualify, and understand their legal and procedural rights, even as the immigration courts experience severe operational challenges.
Legal representation rates vary widely across the country, especially in detention
To understand the unique challenges faced by respondents due to custody status, our analysis separates immigration court data by non-detained and detained cases.9 We find geographical— and court-by-court—variation in legal representation rates over the FY2019-2024 period.
Non-Detained Cases

We focused our analysis on the five courts with the highest and the lowest legal representation rates to determine the largest disparities in legal representation among non-detained cases. We find that the courts with the highest representation rates are on the Pacific Coast of the United States.10 This includes the Honolulu Immigration Court in Hawai’i, which has the highest rate of 69.8 percent. This means that even in Honolulu with its “high” representation rate, nearly a third of noncitizens must defend their cases without legal representation. The other four courts also have representation rates above 60 percent, meaning that about only six in ten people have a lawyer to help them with their case.
In contrast, the five courts with the lowest representation rates are in the South. These representation rates vary between 25.2 to 30.8 percent, meaning only three in ten people have a lawyer to represent them. Harlingen, in southern Texas near the U.S.-Mexico border, has a 25.2 percent rate. This is 44.6 percentage points lower than the Honolulu Immigration Court. This means that people at the Honolulu Immigration Court were nearly 3 times more likely to be represented than those at the Harlingen Immigration Court.
Using the U.S. Census Bureau’s geographic classification by region—Northeast, Midwest, South and West, which includes nine (sub)divisions—to review the distribution of completed cases by region, we find that this pattern holds. The Pacific Coast had the highest representation rate of 58.3 percent, and the South had the lowest representation rate of 39.8 percent.
This regional disparity may be partly explained by the resources available in the location of the court. For instance, some of the courts with higher representation rates are in larger cities compared to less populated or rural locations. This distinction has been shown to be meaningfully associated with variations in representation rates. This is because there are fewer immigration attorneys in small cities and rural areas. Some regions suffer from legal services shortages, where limited presence of immigration attorneys, combined with increasing demand for immigration legal services, leaves respondents with few, if any, options for securing representation.
Researchers have found that legal representation, in the non-detained case context, can depend on other factors too. For example, English proficiency and the size of conational social networks were found to increase the likelihood of obtaining legal representation.
Detained Cases
Focusing on the five courts with the highest and lowest representation rates among detained cases, we find that these rates also varied dramatically. However, courts with higher and lower representation rates are not as clearly concentrated in specific regions as we saw in our analysis of non-detained cases. The top five courts are spread across the Northeast (Varick, Ulster, and Batavia in New York) and the South (Annandale in Virginia and Harlingen in Texas). Similarly, the courts with the lowest representation rates were spread across the South (Houston-South Gessner and El Paso in Texas), Midwest (Kansas City in Missouri), and West (Las Vegas in Nevada and Florence in Arizona).
Nevertheless, considering all completed detained cases per the U.S. Census Bureau’s geographic distinctions, we find that the Northeast had the highest representation rate of 55.7 percent, and the Mountain area11 had the lowest representation rate of 25.4 percent. Indeed, respondents at the Varick Immigration Court in New York City were 4.5 times more likely to be represented than those in the Florence Immigration Court in Arizona, the court with the lowest rate.
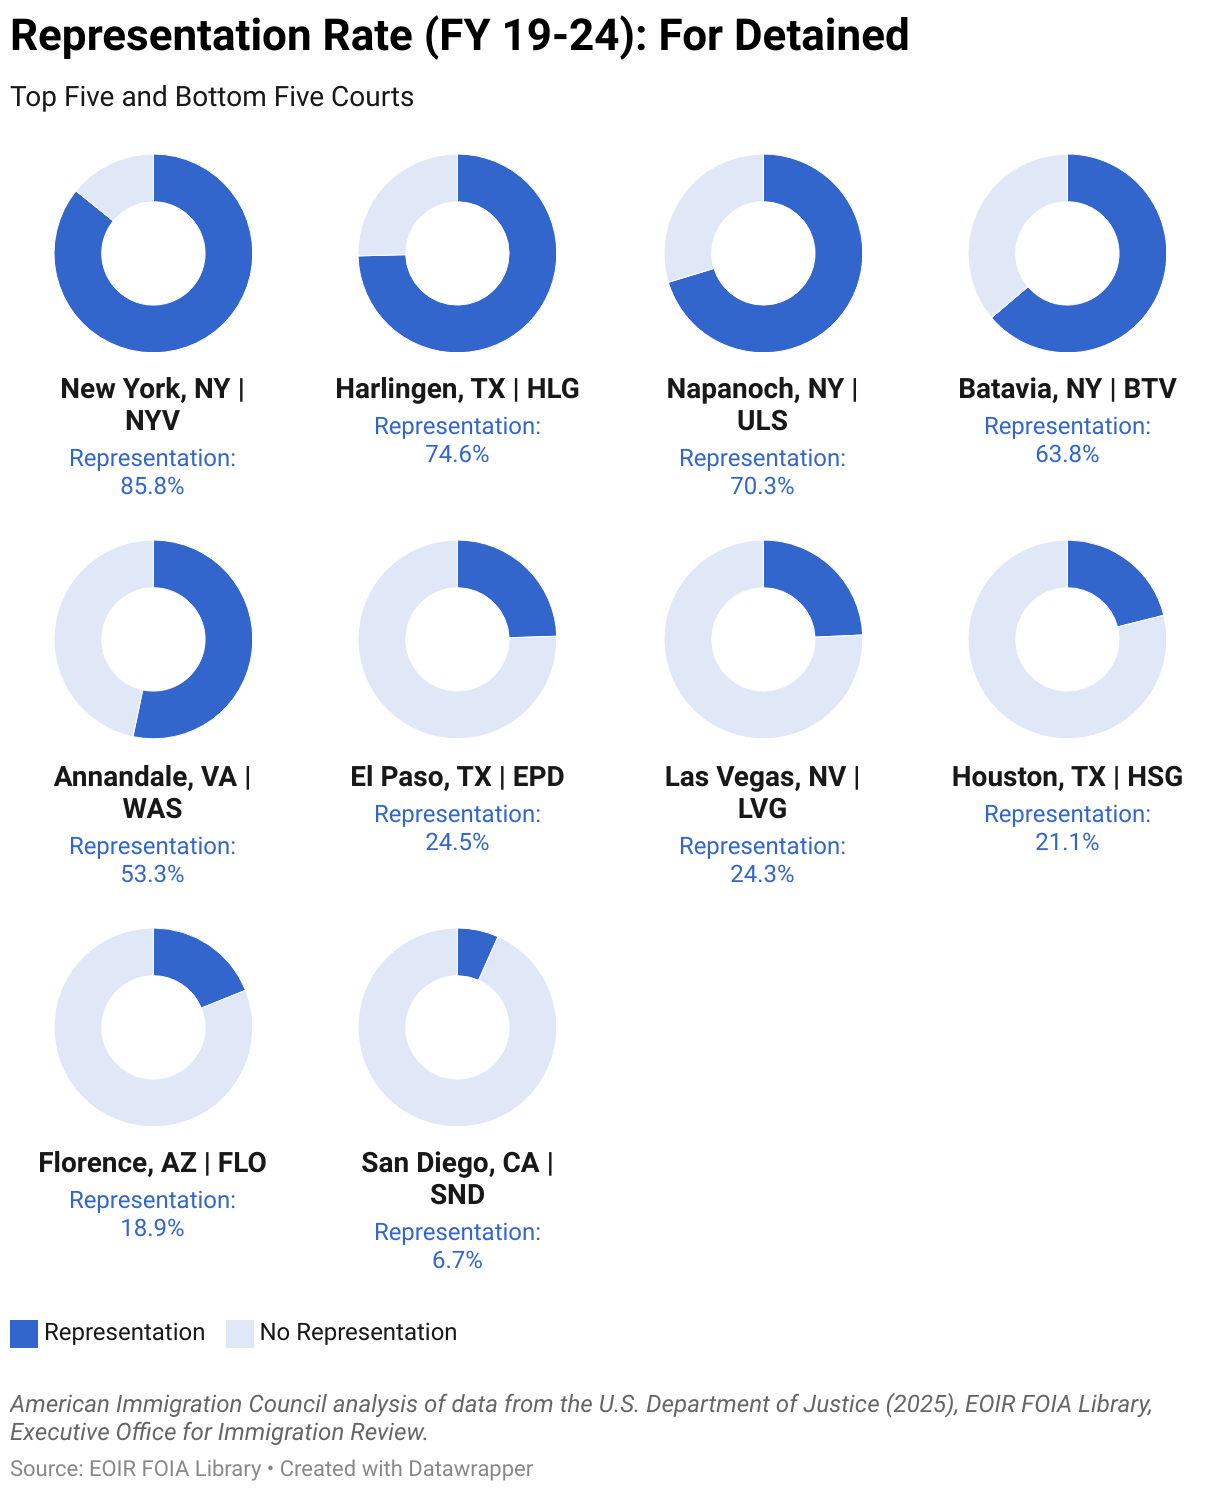
Detained respondents face extraordinary obstacles in accessing legal representation as they must prepare their cases within often geographically isolated detention centers. Researchers have found that detained cases are more likely to be completed by courts in rural locations or small cities. Individuals in detention cannot work and may be unable pay for counsel. Additionally, the odds of finding legal representation are lower in small cities and rural areas compared to larger more urban areas. If they can work, they may earn only one dollar per day through ICE’s Voluntary Work Program. These obstacles make it incredibly difficult for respondents in detention to have the opportunity to legal secure representation.
Government-funded universal representation programs can be an effective means to address these barriers by removing financial obstacles and encouraging attorneys to focus on representing these cases. For example, three of the five courts with the highest representation rates are in New York. Since 2014, New York City has provided free legal counsel to detained respondents at the Varick Immigration Court. A 2017 report showed that this program boosted represented individuals’ success rate by 1,100 percent compared to unrepresented respondents in the same detention facility prior to the program’s implementation.12 This program later was expanded to the Ulster (in Naponoch, New York) and Batavia immigration courts, which boast high representation rates too. Similar programs have been implemented in states such as California, Illinois, New Jersey, New York, Oregon, and Washington, as well as localities in Ohio and Texas.
Removal order rates also vary widely—and detained respondents experience the highest rates
Our analysis looks at removal order rates between FY 2019 and FY 2024 in the United States’ immigration courts, by detained and non-detained cases.13 We find that removal order rates vary widely across courts, but people in detention face significantly higher removal order rates overall compared to non-detained respondents.
Non-Detained Cases
To determine the disparity in removal order rates among non-detained cases, we focus our analysis on the five courts with the highest and the lowest removal order rates. We find that removal order rates in non-detained cases vary dramatically across the country and are likely influenced by factors that influence the overall immigration court systems’ caseload such as having legal representation, local demographics, the court’s location, and federal policy shifts.

The courts with the highest removal order rates are spread across four regions: the South (Texas and North Carolina), West (California), Northeast (New York), and Midwest (Missouri). Notably, three of these courts are near a land border—two with Mexico (Imperial in California and Harlingen in Texas) and one with Canada (Buffalo in New York). And another court on this list, the Charlotte Immigration Court, has one of the lowest legal representation rates at 30.1 percent. Respondents with legal representation are significantly more likely to obtain relief or otherwise avoid removal than those who must navigate the system on their own. One contributing factor is that represented respondents are far more likely to file an application for relief.
Similarly spread out, courts with the lowest removal order rates are in the South (Florida), Northeast (Massachusetts), West (California), and Puerto Rico. The Chelmsford Immigration Court has a very low removal order rate at 7.3 percent but has a small caseload. That court only opened in March 2024, the last year of the time period we analyzed, which could also mean that the cases transferred and completed in FY 2024 were stronger or had legal representation. Interestingly, while both the Orlando and Boston courts have a similar removal order rate, Orlando has a significantly lower representation rate (35.6 percent) than Boston (60.7 percent).
Overall, the Pacific Coast had the lowest removal order rate of 34.2 percent, while the Midwest had the highest removal order rate of 46.2 percent. The relatively low 12 percentage point difference among these two regions, however, underscores the finding that there isn’t a particular area where non-detained cases experience dramatically high or low removal order rates. As mentioned previously, legal representation can lead to lower removal order rates so barriers to legal representation—such as geography, lack of English proficiency, and smaller social networks—can similarly impact removal order rates. Researchers have also found that the characteristics of immigration judges significantly influence the outcomes of removal proceedings, particularly their gender and experience.
Detained Cases
Focusing on the five courts with the highest and lowest removal order rates among detained cases, we find that the courts with the highest removal order rates have less geographic variation. The top five courts with the highest removal order rates are in two regions: the Midwest (Missouri and Ohio) and the South (Texas and Georgia). Kansas City Immigration Court in Missouri and Stewart Immigration Court in Georgia were tied for the highest removal order rate for detained cases at 95.2 percent. Removal order rates for these five courts are all above 90 percent, meaning 9 out of 10 people are ordered removed. In contrast, the courts with the lowest removal order rates for detained cases are spread across the country: Northeast (New York), Midwest (Illinois), West (California), and South (Texas). These respondents do not fare much better, however. At the El Paso Immigration Court in Texas, the court with the lowest rate, 72.9 percent of respondents were ordered removed.
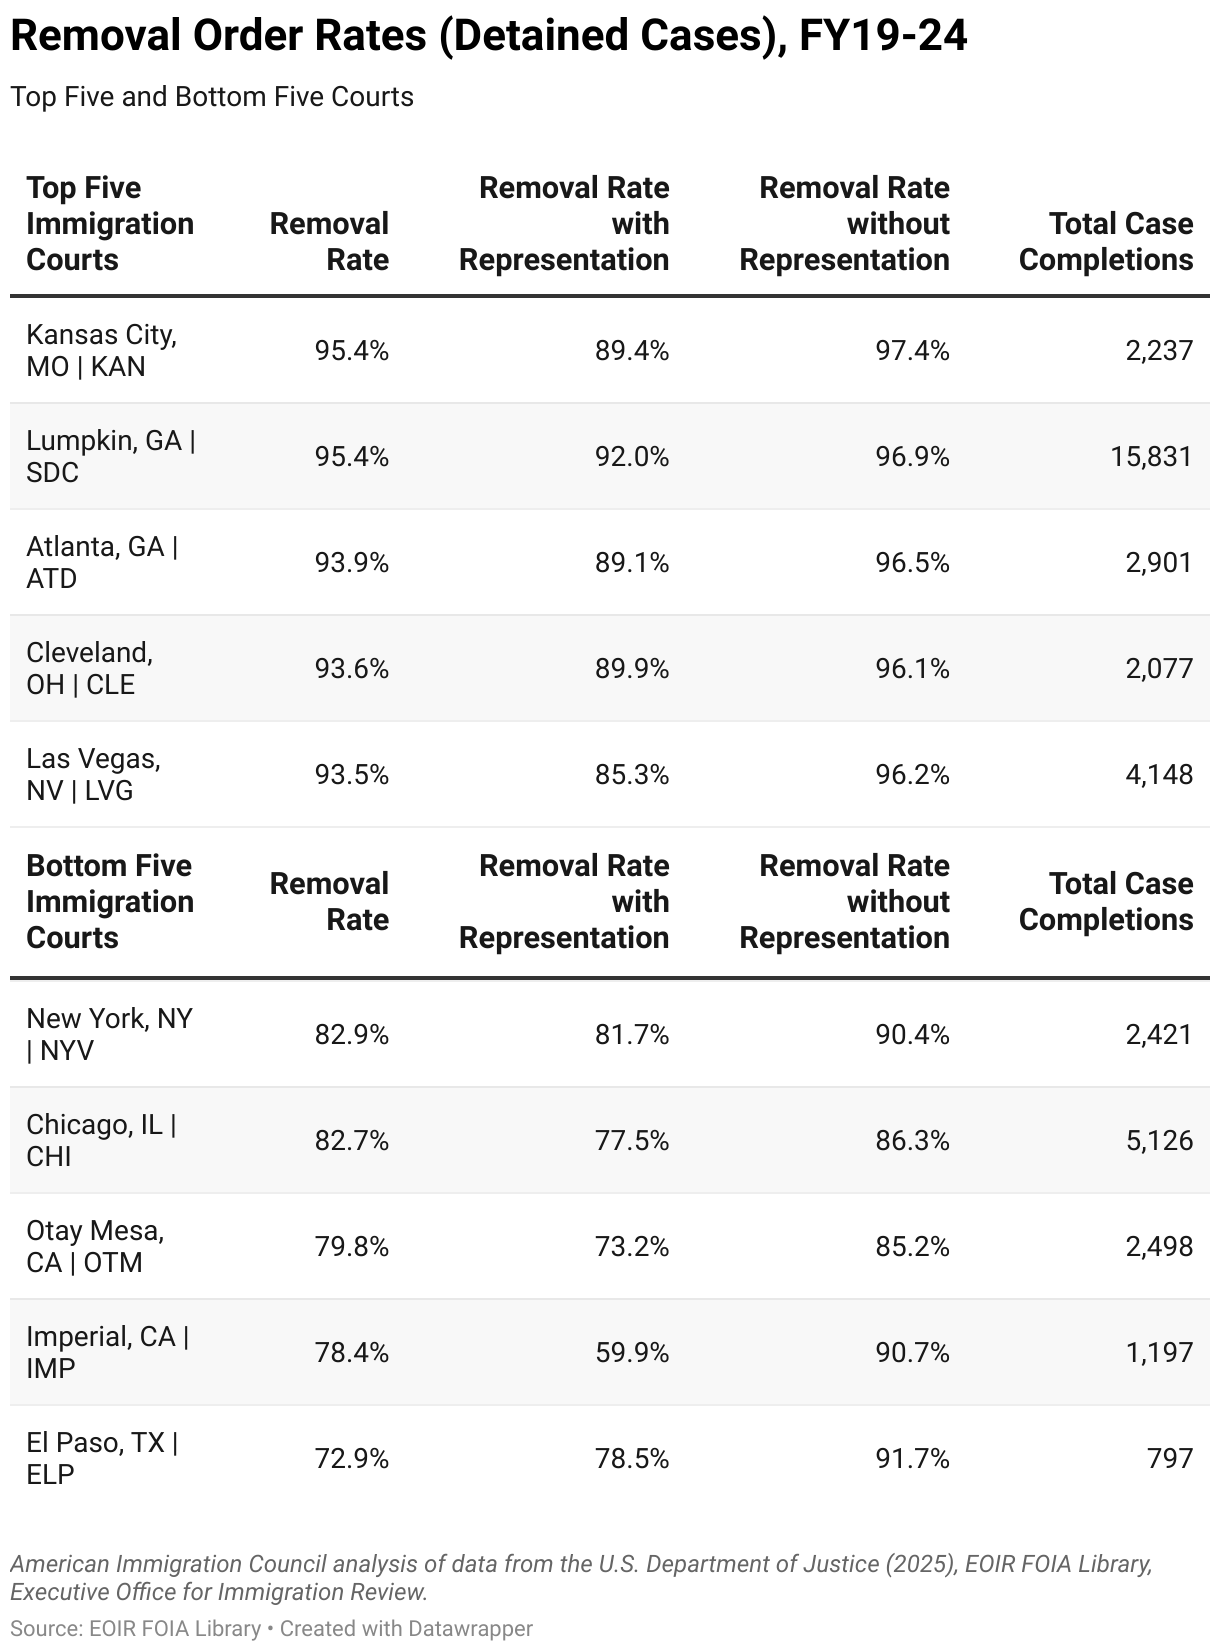
Overall, we find that courts with detained cases have significantly higher removal order rates compared to courts with non-detained cases. While similar factors influence both case types, this finding indicates that additional factors may lead to less successful case outcomes for people in detention.
A recent study found that immigration courts handling detained cases often have distinct features compared to those primarily focused on non-detained cases. For example, the study found that judges hearing detained cases tend to be male and have military and prosecutor backgrounds.
Additionally, cases for people in detention have historically been subject to strict adjudication timelines, requiring resolution within a set number of days. By contrast, respondents who are not detained generally have greater access to counsel, community support, and time to prepare their cases. DHS also exercises broad discretion in determining where to detain a noncitizen. This means that some respondents may be sent to detention centers far from their homes and far from important paperwork, witnesses, attorneys, and social support services.
Policy changes likely influenced case outcomes
We find that outcomes in immigration courts across the country followed trends in policy shifts made under the two presidential administrations in office between FY 2019 and FY 2024. As previously mentioned, the pandemic significantly affected case processing at the immigration courts during the six-year period covered in this data. However, comparing FY 2019, the last year not affected by the pandemic during the first Trump administration, and FY 2024, the last full fiscal year of the Biden administration, we can assess how changes in immigration court policy and federal enforcement priorities may have influenced ultimate case outcomes.
Under the first Trump administration, cases ending in removal orders reached 79.6 percent of all completions in FY 2019. In comparison, the percent of cases resulting in removal orders in FY 2024 under the Biden administration decreased to 40 percent, which is about half the number in FY 2019.
In reviewing the make-up of overall outcomes, we find that decisions under the Trump administration skewed toward removal orders while the outcomes under the Biden administration were more varied. For example, in FY 2019, only 20.4 percent of completed cases included an outcome resulting in the respondent being able to stay in the United States.14 However, in FY 2024, 60 percent of cases resulted in an outcome other than a removal order.
These trends align with the immigration court and federal immigration enforcement policies under both administrations. Between January 2017 and January 2021, under the Trump administration, ICE limited the ability of its agents and OPLA attorneys to choose not to seek to deport certain noncitizens, while EOIR placed case completion quotas on judges that were part of an aggressive effort to impose “fast and frequent removals of noncitizens” and the Board of Immigrations Appeals used precedential decisions to narrow asylum eligibility.
When the Biden administration took office in January 2021, it reversed many of the restrictive Trump administration’s policies, allowing ICE to exercise favorable prosecutorial discretion to not enforce immigration law against certain noncitizens based on specific enforcement priorities, and restoring judges’ authority to manage their caseloads, including the ability to seek the termination or dismissal of low-priority cases.
The Biden administration also worked to decrease the backlog; however, a continued rise in border encounters resulted in an increase in new case filings and the overall backlog. While the FY 2024 case outcomes may reflect both the influence of the Biden administration’s policies and the lasting effects of the pandemic on immigration court operations, a pattern emerges that show a clear divergence in case outcomes between the two administrations.
Conclusion
This report demonstrates that having legal representation improves outcomes regardless of detention status or court location. Yet major disparities persist, with detained respondents facing the lowest representation rates and highest removal order rates, and outcomes varying widely by region. Policy changes also appear to shape these results, as shifts in removal order rates align with shifts in enforcement priorities and changes in presidential administrations. This is important to remember as the Trump administration continues to erode noncitizens’ due process in pursuit of deportation quotas. Ultimately, building a fairer immigration court system will require reducing the use of detention, ensuring universal access to counsel, protecting the immigration courts from political influence, and reaffirming the principle that every person deserves a meaningful opportunity to be heard.
Data Source
We obtained EOIR Case Data from the EOIR FOIA Library. At the time of downloading the data, the most recent update available was from April 2025. EOIR Case Data may change slightly with each monthly release in the FOIA Library.
Initial Data Cleaning
We began the cleaning process by ensuring the data were formatted in a consistent way that allows for data aggregation across the datasets.
To do this, we removed excess spaces before or after text and any hidden ASCII characters within the data. We treated data points as missing—recoding them as NULL—if they were blank, contained only ASCII code, or did not match any likely real output for the variable (e.g., a letter in a date variable, a charging document issued before 1950, or an EOIR-28 form filed in 1900).
In addition, we excluded observations that lacked information critical for linking the observations across tables. We excluded observations with missing values for Case ID, Proceeding ID, or the date when DHS issued a charging document. We also excluded observations with Case ID values that did not exist in the lookup table provided by the EOIR FOIA library.
Case Selection
We removed observations from the dataset that were outside the scope of our analysis, which focuses on removal proceedings adjudicated between FY 2019 and FY 2024.
Thus, we included only observations with the case type for removal proceedings. We excluded observations representing procedural decisions by immigration judges—such as change of venue or transfer—which are not considered substantive, or merits, decisions. Similarly, we removed observations indicating an outcome of "zero bond," where individuals receive a bond hearing before the court receives their charging document, which are not considered decisions on the merits.
Finally, we excluded observations that were pending or adjudicated outside of the timeframe of our analysis, which focused on the period between FY 2019 and FY 2024.
Initial Merits Decisions
Following previous research on EOIR Case Data, we analyzed the initial merits decisions. We excluded subsequent case completions, which can result if a decision is appealed or reopened after the initial resolution of a case. Our approach examines the first substantive decision found for each observation across the proceeding, case identifier, and schedule tables.
Beginning with the proceeding table, we grouped the data by case ID, keeping the observation representing the earliest completion date. For proceedings with identical completion dates, we identified the initial merits decision by the hearing date, keeping observations if they represented initial Master or Custody hearings. For proceedings with multiple completion and hearing dates, we identified the initial merits decision by the input date (i.e., the date that the court received the proceeding or the date that the proceeding was automatically created).
A small number of cases had identical completion, hearing, and input dates. If the case was a true duplicate (all information including the decision code was the same), we kept only one of the proceedings. If the decision code is different but all other information was identical, we prioritized the observation if it had a decision code indicating removal. We also prioritized the observations that have a hearing date over the ones that lack such information.
After cleaning the proceeding table, we began the process of cleaning the scheduling table. First, we excluded observations with proceeding IDs that were also not present in the proceedings table. Some cases had multiple rows of data. When determining whether to keep or remove a duplicate row, we kept the observation if EOIR Attorney ID was present and the value for the adjudication reason variable indicated a hearing took place during the proceeding. For cases with identical information but multiple hearing dates, we kept cases with the earliest scheduled hearing.
Then, we used the Case Identifier Table to identify Migrant Protection Protocol (MPP) cases. Here, we excluded all rows with case identifier values that were MPP. After excluding these rows, there were no duplicates in this table.
Finally, using the Representatives Assigned Table, we limited the dataset to include only the earliest filing of the EOIR-28 form, which maintained consistency with our examination of initial merits decisions.
Merging the Tables
After cleaning the individual tables, we used shared case and proceeding IDs to merge A_TblCase (Case Table), B_TblProceeding (Proceeding Table), tbl_schedule (Schedule Table), tbl_RepsAssigned (Representatives Assigned Table), and A_TblCaseIdentifier (Case Identifier Table) into one dataset for further analysis of representation rates and proceeding outcomes.
Endnotes
See Immigration and Nationality Act (INA) section 240(b)(4)(A) (8 U.S.C. § 1229a(b)(4)(A)) (providing that "the [noncitizen] shall have the privilege of being represented, at no expense to the Government, by counsel of the [noncitizen]'s choosing who is authorized to practice in such proceedings"); INA section 292 (8 U.S.C. § 1362), "In any removal proceedings before an immigration judge and in any appeal proceedings before the Attorney General from any such removal proceedings, the person concerned shall have the privilege of being represented (at no expense to the Government) by such counsel, authorized to practice in such proceedings, as he shall choose."; see, e.g., Biwot v. Gonzales, 403 F.3d 1094, 1098 (9th Cir. 2005) ("The right to counsel in immigration proceedings is rooted in the Due Process Clause . . . ."); see also Leslie v. Att'y Gen. of U.S., 611 F.3d 171, 181 (3d Cir. 2010) ("[T]he Fifth Amendment . . . indisputably affords a [noncitizen] the right to counsel of his or her own choice at his or her own expense.").↩︎
In determining which administrative control immigration courts primarily handled detained and/or non-detained cases, we identified the courts that completed at least 500 cases between FY 2019 and FY 2024 for each case type. Because some courts completed more detained cases in the beginning part of the period compared to the end, largely due to operational and policy changes, we limited that group to those courts that completed at least 82 cases (or 1/6 of all cases) within the last year. This ensured that we identified a meaningful and contemporary understanding of courts that actively adjudicated detained cases.↩︎
Other types of proceedings before the immigration courts include deportation and exclusion proceedings; rescission proceedings; credible fear proceedings; reasonable fear proceedings; claimed status review; asylum-only proceedings; and withholding-only proceedings. See U.S. Department of Justice, Executive Office for Immigration Review, Immigration Court Practice Manual, Chapter 7.1, "Other Proceedings Before Immigration Judges: Overview," accessed November 13, 2025, https://www.justice.gov/eoir/reference-materials/ic/chapter-7/1.↩︎
EOIR classifies a respondent's custody status as "detained," "never detained," and "released." We considered a person as "non-detained" if they had a custody status of never detained or released at the time of their initial merits decision.↩︎
An immigration judge's decision may be appealed to the Board of Immigration Appeals (BIA), and the BIA's decision can then be appealed to a federal appellate circuit court with jurisdiction over the originating court.↩︎
This outcome may not include all the cases where the outcome resulted in a grant of withholding of removal or under the Convention Against Torture. This is because EOIR labels some proceedings with these grants as "relief." We identified that less than 17,000 cases were granted these application types during the six-year period in this report, which is a small fraction of the over 2 million outcomes we analyzed.↩︎
These outcomes end a proceeding in one immigration court to begin a new proceeding at another court.↩︎
Importantly, there are many people who may be ineligible for certain forms of relief due to legal restrictions, including the passage of time or criminal histories. This means that withholding of removal or protection under the Convention Against Torture—which are granted after a person is ordered removed—may be only two of the few forms of relief from removal available to them. Thus, while not being ordered removed is a preferable outcome, that option is not available to many and legal representation can be crucial to obtaining these forms of protection.↩︎
In our study, we removed completed cases which were also identified as part of the Migrant Protection Protocols (MPP) program. See 8 C.F.R. § 235.3(d) (noncitizens in MPP shall be considered detained for their proceedings). People in MPP had to remain in Mexico for the duration of their proceedings. When they presented themselves at the border, DHS took them into custody, and they were transported to their immigration court hearings. Representation rates for the people subjected to MPP were extremely low and, according to one analysis, were as low of 4 percent. To ensure that these unique circumstances did not skew our analysis, we removed these cases from the data analyzed.↩︎
Under the U.S. Census Bureau's classification, the United States is divided into nine divisions. Relevant here, the Pacific Division, referred to as "Pacific Coast" in the text, includes Alaska, California, Hawai'i, Oregon, and Washington.↩︎
Under the U.S. Census Bureau's classification, the United States is divided into nine divisions. Relevant here, the Mountain Division, referred to as "Mountain area" in the text, includes Arizona, Colorado, Idaho, Montana, Nevada, New Mexico, Utah and Wyoming.↩︎
The 2017 report defined "success" as outcomes from immigration court resulting in relief from removal, termination, or administrative closure.↩︎
In our study, we removed completed cases which were also identified as part of the Migrant Protection Protocols (MPP) program. See 8 C.F.R. § 235.3(d) (noncitizens in MPP shall be considered detained for their proceedings). People in MPP had to remain in Mexico for the duration of their proceedings. When they presented themselves at the border, DHS took them into custody, and they were transported to their immigration court hearings. Representation rates for the people subjected to MPP were extremely low and, according to one analysis, were as low of 4 percent. To ensure that these unique circumstances did not skew our analysis, we removed these cases from the data analyzed.↩︎
These outcomes include Relief, Terminations and Dismissals, and Other. See "About the Data" section for more information.↩︎